Charts are the pictorial depiction of data which gives a very easy to learn, easy to note data presentation. They are best useful when data is very huge and is to be presented on a very minute scale. Charts helps in making a presentation easier to present and compact. Huge data can be compacted to a single diagram or chart or any other required picture.
In Microsoft Powerpoint we can insert charts into presentation that will help minimize the slide space usage and also makes it easy to show numerical data in a pictorial way.
To insert charts in Microsoft Power point:
1) Click on the slide chart figure

2) It will show different templates to choose from that comes in common with Word and Excel.

3) Say we have chosen Column template from the list, it will show the excel data to choose the values.

4) We can simply edit the data to change the figure in the chart.
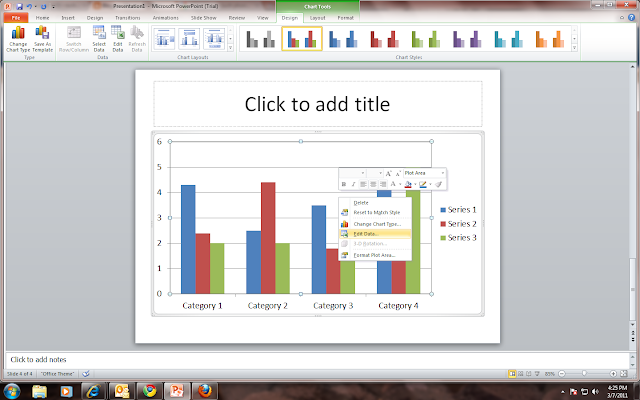
Even after inserting the chart completely right click on the chart and we can edit the data. This way we can change the data as per the requirement. This will make use of excel and import chart templates from it.


0 comments:
Post a Comment